Covid Stories: "Yellow Bricks" to "Tricky Tricks"
How "Attack of the Blue Meanies" extends the tradition of "The Wizard of OZ"
Did you know The Wizard of OZ is actually a political allegory about United States monetary policy circa 1890’s?
The backstory is fascinating.
If you are concerned about inflation and illegal migration, yet are unaware of the symbolism and context within which L. Frank Baum wrote his world-famous tale “for children”… then hold onto your hat!
Because this rich bit of American history, is likely to blow your mind.
Now, ladies and gentlemen, boys and girls…
LocustsForBreakfast proudly presents tonight’s performance, in three acts…
Covid Stories: "Yellow Bricks" to "Tricky Tricks"
How "Attack of the Blue Meanies" extends the tradition of "The Wizard of OZ"
ACT I
Like most good stories, this one begins “a long time ago”.
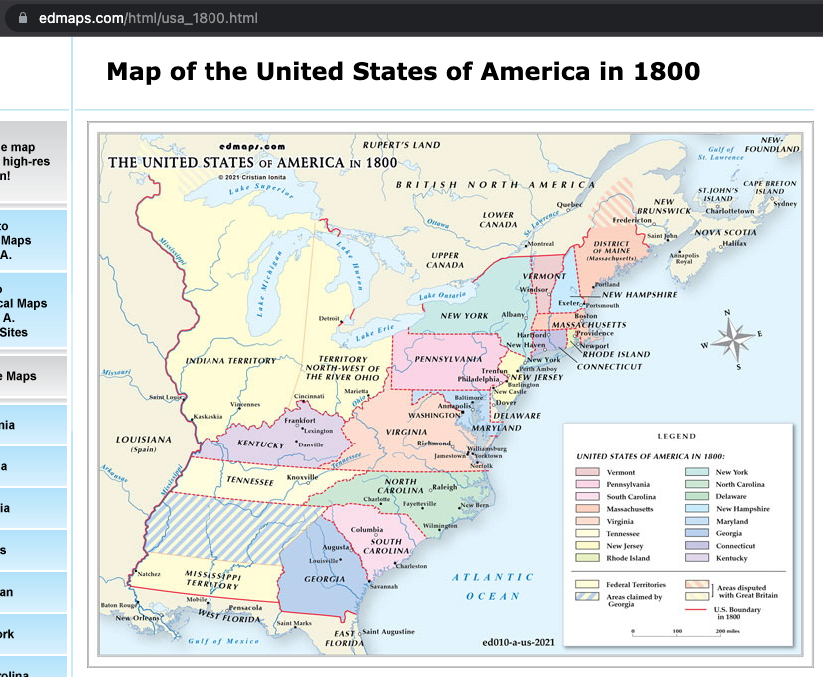
Shortly after the turn of the century in 1800. Way back when the United States was much smaller. And mostly agrarian.
In the 1830’s, at the height of the Industrial Revolution, the United States’ economy was booming. Especially in the northeastern states.
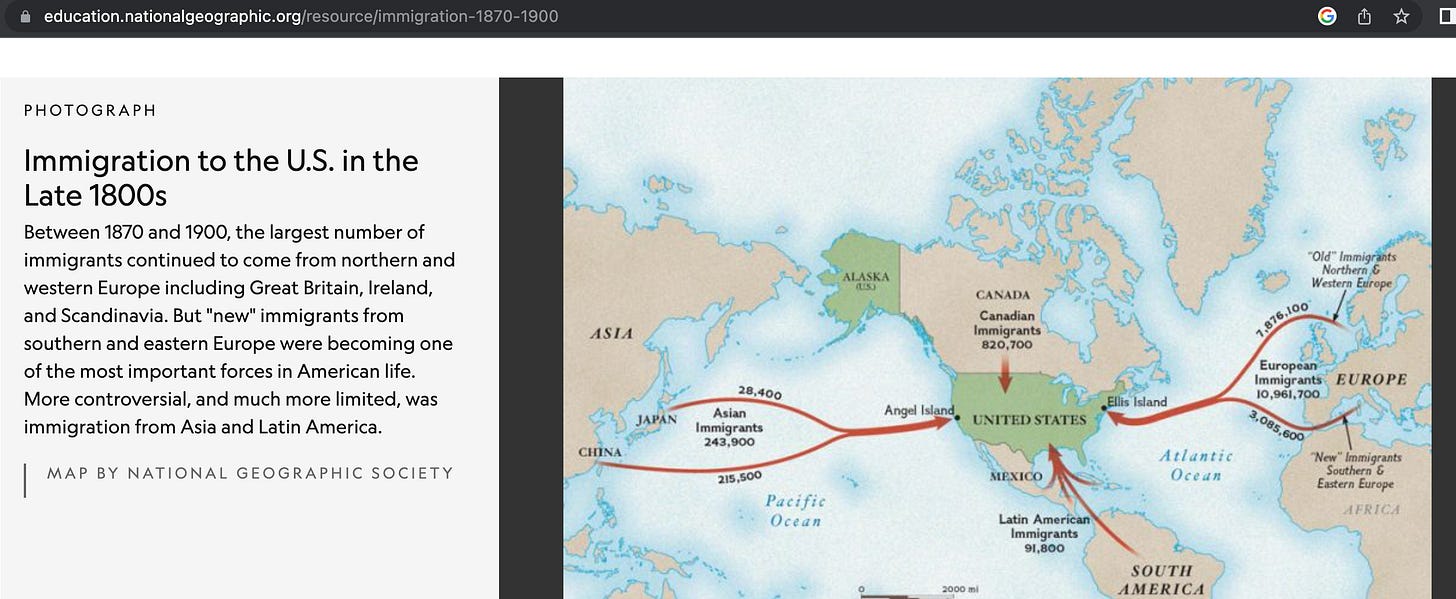
And that booming economy was matched by an unbridled growth in population. Although the rate of growth was due in part to larger-sized families, it was largely a reflection of massive immigration, mainly from European countries.
Sounds like an amazing time to live in the USA, right?
Well, there was one itty bitty, teeny tiny little problem... a problem that ended up hurting a lot of people. Families and children starved.
What sin was responsible for this unexpected outcome?
No, it wasn’t “Dr. Evil”.
I’m afraid it was someone far less conspicuous. Or rather something.
Yes, I’m talking about “Dr. Au” (aka. “gold”).
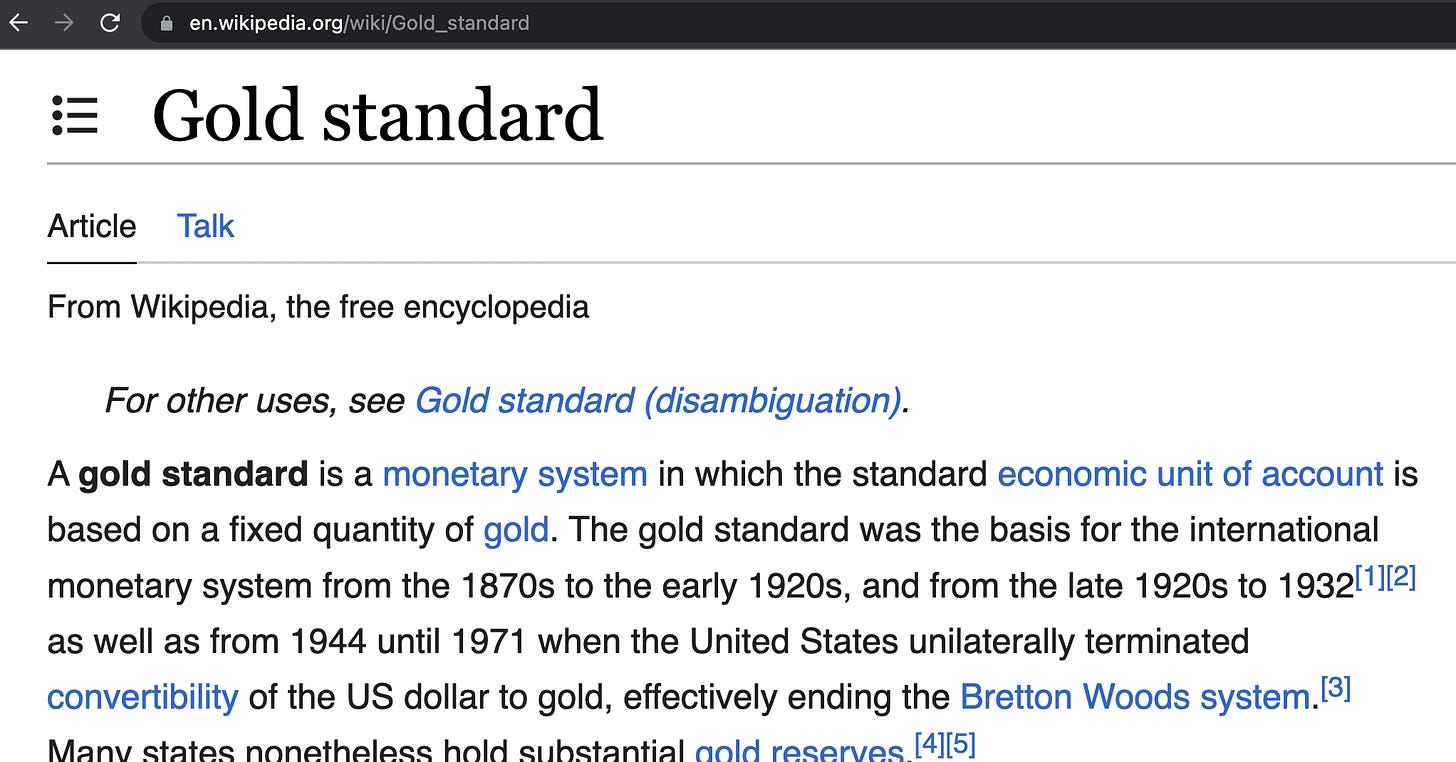
Actually, more specifically, the problem was the USA didn’t have enough of the yellow metal. You see, unlike today’s “print as much as you want” Federal Reserve Note dependent semi-global economy; back in 1830’s-1890’s America, our great-great-great-grandparents relied on the United States Note tied to the Gold Standard.
Let’s recap what we’ve seen so far:
early-stage geographical footprint
agriculture-driven economy
tech-enhanced economic boom
immigration-enhanced population boom
sound money, pegged to gold
… and the people starved???
What? How does that last point make any sense?
Let’s take a moment to dig into some simple math and clarify the underlying mechanics to shed light on this important “eat or starve” aspect.
Imagine ten people each owning 1oz of gold create a new economy.
Initially, all of the gold is in the hands of the people. Business is conducted by trading physical gold with each other. So far, so good.
Because gold is cumbersome and paper is easier to manage, the people establish a bank and print ten (10) paper notes; one “dollar” for each 1oz of gold. The ratio is 1:1. Essentially, the value of each dollar is one ounce of gold.
Although one person does not trust the bank and opts to keep possession of his physical gold (“what’s to stop the bank from cheating by printing extra dollars?”), everyone else chooses to deposit their gold in the bank in exchange for paper dollars. The result is nine paper dollars and 1oz of gold in circulation.
$9 + 1 oz = 10 units of exchange
Now let’s pretend the only “things” bought or sold in this imaginary economy are ten identical houses. Because the ratio of houses to units of exchange is 1:1, the price of each house is one (1) unit of exchange.
1 house = $1 = 1 oz = 1 unit of exchange
Then the unexpected happens! There’s a gold rush! 90 ounces of gold are discovered and suddenly added to the economy. The bank gladly accepts the new deposit of gold and quickly prints ninety more paper dollars to maintain the 1:1 ratio between dollars and ounces of gold. Now there is ninety-nine paper dollars and 1oz of gold in circulation.
$99 + 1 oz = 100 units of exchange
What about the houses? The number of houses hasn’t changed. That ratio becomes 10:1, making the price of each house jump 1,000%. Talk about inflation!
1 house = $10 = 10 oz = 10 units of exchange
Over the following year, 90 new houses are built (identical to the original ten). Month by month, as houses are completed, the price of each house falls until the 1:1 ratio is restored.
The ratios are, once again, 1:1. Hooray!
And the overall size of the economy is 10x larger, growing to 100 units of exchange.
However, the real estate industry has mixed opinions. They liked it when housing prices rose. Then, when prices fell back down... not so much.
Because higher prices equal higher commissions, the real estate agent of the group understandably expresses some frustration and says to the other nine, “Why did we build all those houses? There’s only ten of us!!!” Lol, good point!
What’s more, we don’t really know the distribution of wealth. Although some of the people found more gold than others during the gold rush, the amount of wealth each person has is unclear. Because there’s $99 paper dollars and 1oz of gold in circulation, what we can say is there are 100 units of exchange and that on average each person has $10 worth of purchasing power in their pocket.
100 units / 10 people = ave 10 units per person
Since 90 of the houses are unoccupied, let’s grow the population!
Imagine 90 penniless immigrants arrive. Working for the established home owners, overtime some of these new arrivals work extra hard and earn enough to own their own home (while others work less and rent instead).
Across the board the ratios are once again 1:1.
1 house = $1 = 1 oz = 1 unit of exchange
100 units / 100 people = ave 1 unit per person
With this review of Economics 101 now under our belt, let’s resume to our history tour of 1800’s America.
Where were we?
Oh yes, “… and the people starved”!
1892 was a dumpster-fire of a year.
So was 1893 and 1894.
Can you imagine having to go through 2020 three years in a row?
Just like how we are enduring the aftermath of a biological attack, our recent ancestors suffered through a nearly equally severe economic event in the 1890s.
Here’s how their “Covid Story” went down…
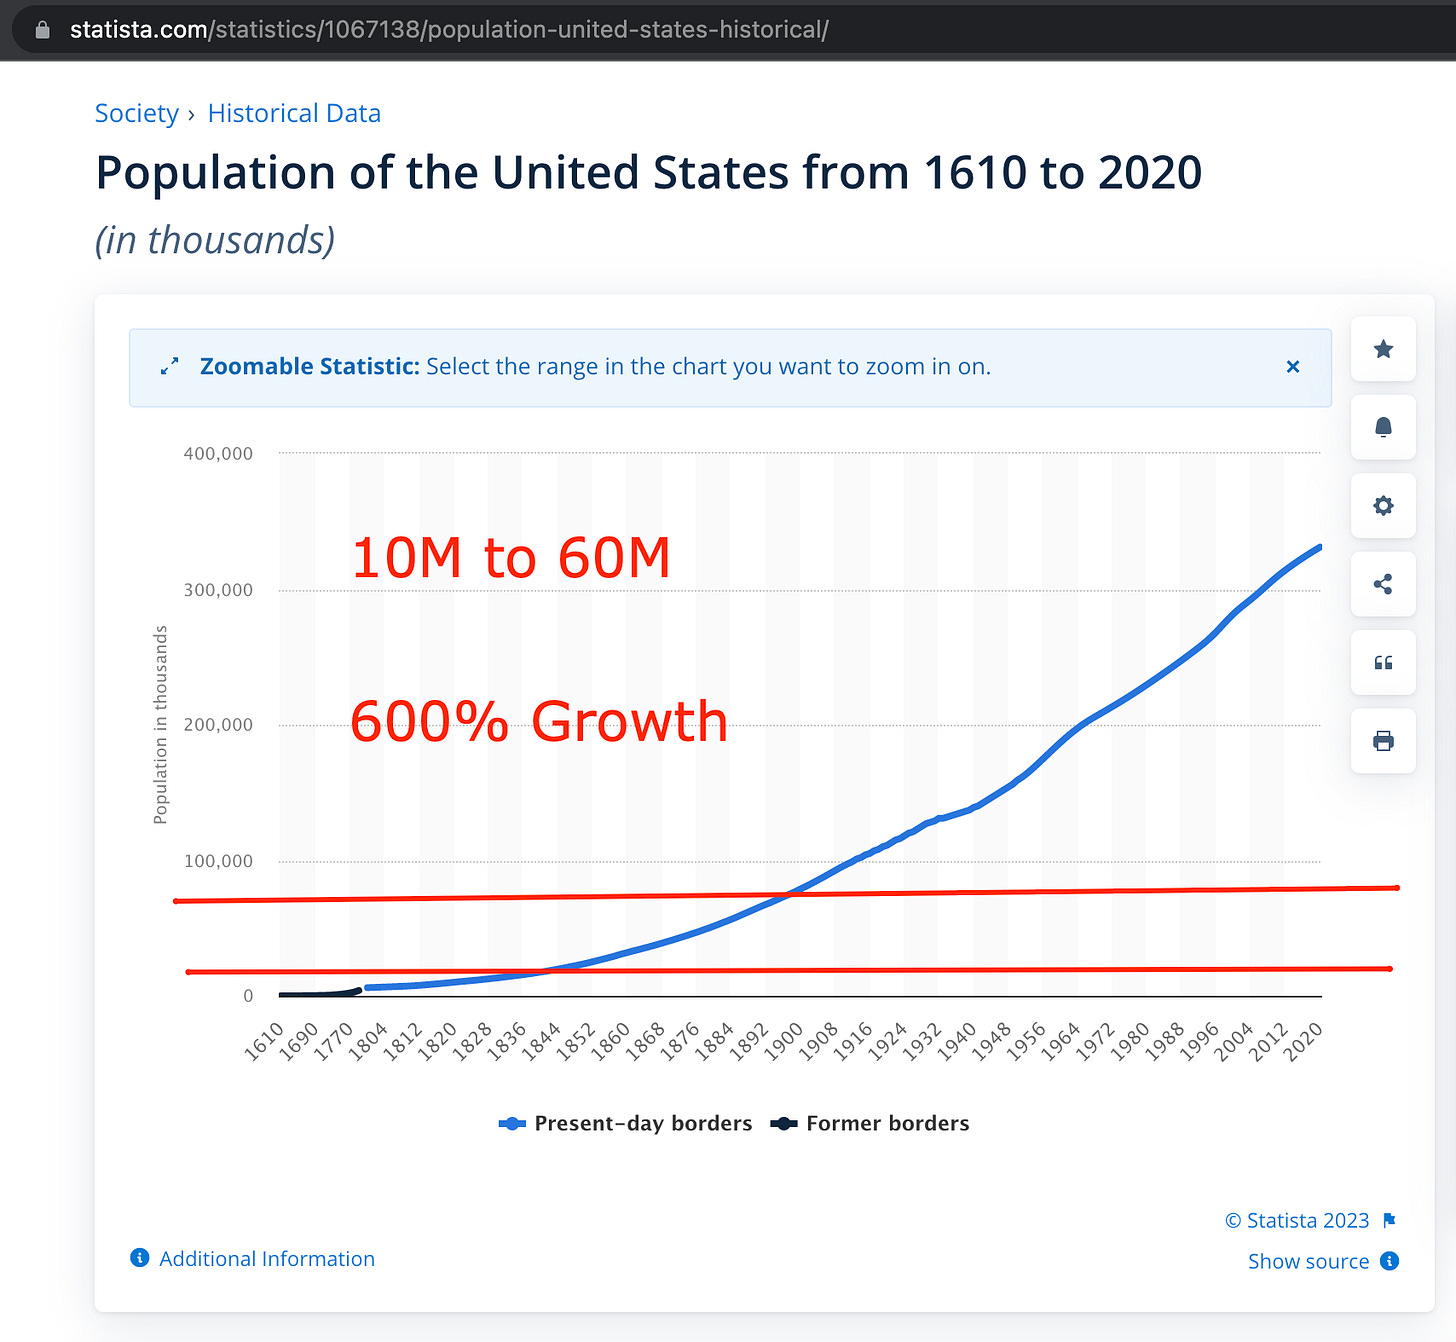
In 1800-1830, the US had populations between 6 and 13.2 million. To keep the math simple, let’s use 10 million for a baseline.
By 1890, US population had grown to 64.7 million (which we will round to 60 million). That’s 600% growth in the span of approximately 60 years.
Although the northeastern states had embraced the Industrial Revolution, most of America was agrarian with approximately 90% of families living on their own farms.
6th grade educations were uncommon. Those with as little as an 8th grade education had a tremendous competitive advantages over their fellow citizens.
There were no computers. No telephone lines. Sparse telegraphs. Mail delivery took days and weeks.
To a large extent, news traveled by word-of-mouth. Or “Ye Ol’ Ale House” to “Ye Ol’ Ale House”, to be more accurate.
Without just-in-time access to reliable data, traditions ruled society to keep things aligned and humming along… that is, until they didn’t.
https://www2.census.gov/prod2/statcomp/documents/CT1970p1-06.pdf
From 1878 to 1894, wheat prices dropped dramatically from traditional levels in the $1.03 to $1.25 range down to a low of $0.56. That was a reduction of 55% in 15 years.
Look closely at the prices from 1886-1894. Notice how prices trended up over seven years before peaking in 1891, then dropped +15% year over year for three years in a row.
Can we begin to imagine what that experience must have been like for those financially-illiterate farmers? Allow me to speculate as to what would have been a reasonable way they might have thought about those price trends back in 1891:
“Everybody knows Wheat prices should be $1.25. It’s been four years since 1887’s $0.80 price, which has got to be the worst case scenario. Thank goodness things are steadily recovering and we won’t see those prices anymore. Still, it just doesn’t make any sense. The news says the government is processing record immigration numbers. One would expect that means there’s got to be lots more mouths to feed. I seriously doubt all those new people are starting farms. Wheat prices should be going way up, not flat or slightly up! It just doesn’t make any sense. It must be those suit-and-tie wearing fellas running the price desk up there in Chicago. They must be fixing prices or pulling some other sort of shenanigans.
All I know is it ain’t right.
But what can I do?
I’m just a farmer.”
Banks must have been booming.
All those farms operating a full decade on 72% of traditional price levels. Each year dipping further and further into savings to keep their farms going. If it wasn’t the business model from the outset, this period of hardship could have easily taken the practice of “taking out loans from the bank in order to purchase seed” mainstream.
And can you image how the 8th grade educated bankers wrote the terms of the loans they offered to the 6th grade educated farmers? Here’s my speculation on how one of those conversations might have went down:
Banker: “Mr. Farmer, here are the terms our bank president has approved me to offer to you. Using your farm as collateral, our bank will loan you money for you to seed your fields.”
Farmer: “That’s fine news. My family and I appreciate you and your fine bank.”
Banker: ”This year’s Wheat price is currently at $0.96, which rose $0.06 against last year’s price of $0.90. Financial experts in Chicago are forecasting 1892’s market prices will continue to increase to $1.02 as Wheat prices continue to climb back to the target historical price of $1.25.”
Farmer: “$1.02? You don’t say. My neighbor said he read the same number in the newspaper a week ago. If that’s what Chicago says, that’s good enough for me.”
Banker: “Our terms will allow you to profit $0.17 from the forecasted price as we only require return of our principal investment and interest charges which work out to $0.85 per bushel.“
Farmer: “Sounds about right. Where do I sign?”
Looking back at our chart, we know the forecast was wrong and the farmer is only going to get $0.79 per bushel, $0.06 less than what he needs to pay off the bank. And we know any similarly optimistic forecast will be wrong for the following 2-3 years until things finally hit rock bottom and flatten out.
For farmers who took out these sorts of loans, it was only a matter of time until those harsh economic conditions positioned the banks to foreclose on their farms.
Okay. Now we know how their story ends.
But the ending is not the whole story. There is still the mystery of “Why did prices fall in a period of dramatic growth of demand?” to solve!
Let’s take another inventory, this time of the known facts:
population up 600%
prices down 20-40%
Did prices go down due to supply increasing faster than demand? The following chart published by the University of Houston says the supply trend went exactly the opposite way!
Let’s add this nugget to our list :
population up 600%
prices down 20-40%
relative supply down ~25%
It makes NO SENSE!!!
What could the logical reason be?
Are we ready to don our tinfoil hats and join the farmer and blame those “suit-and-tie wearing fellas at the price desk in Chicago” of shenanigans?
There must be something else we are overlooking…
Oh yeah, silly me. Of course.
Gold!
Let’s take a look at the money supply.
Wowzers!
Gold production from 1850-1890 trended downward.
Let’s add this bit to the top of our list :
relatively fixed money supply
population up 600%
prices down 20-40%
relative supply down ~25%
Do you see it now? These facts all line up!
Here’s the narrative…
From 1850-1890 the US money supply remained relatively fixed while population increased 6x. At the end of the period, average buying power of American households was most likely near 1/6th of beginning levels. Retail prices weakened as reductions in average household buying power translated into widespread reductions in buyers’ ability to pay. Eventually, the weakened retail prices were reflected by lower wholesale prices.
Economists use (In)Elasticity of Demand to characterize changes in market prices. Prices are considered elastic when buyers care less about the price. Alternatively, prices are considered inelastic when buyers forego purchases due to the price point. For example, if the price of a loaf of bread is $0.10 when the average household has $2 (or 5% of the household’s total purchase power); what price will a loaf of bread sell for when the average household only has $1? Although the supply chain likely continues to want $0.10, because the buyer is used to spending 5% of his purchase power… retail’s ask for 10% of the buyer’s purchase power creates a financial tension. The buyer has two options. Accept the price, which results in a transaction. Or reject the price and forego the purchase. Of course, there’s also a third possibility where by the parties negotiate the price which also results in a transaction at a lower total cost to the buyer. When buyers (a) forego purchases or (b) negotiate; these market signals indicate prices are inelastic.
In other words, the households said “we can’t pay $0.10 for a loaf of bread”.
Not wanting the inventory to spoil, the retailers asked “what can you pay?”
“$0.05”, said the buyers.
“$0.08?”, said the sellers.
“$0.06!”, said the buyers.
“$0.07?!?!”, said the retailers.
“… sold”, said the households.
Then the retailers negotiated with the bakers. Then the bakers negotiated with the mills. Then the mills told the “suit-and-tie wearing fellas at the price desk in Chicago” what they were willing to pay. And then, this happened…
Farmer 1 (on his way to Chicago with his wagons full of grain to sell)
Farmer 2 (on his way back home from the markets in Chicago)
Farmer 1: “Howdy, sir. It’s a fine day, ain’t it?”
Farmer 2: “No, sir! Haven’t you heard?”
Farmer 1: “Heard what?”
Farmer 2: “Chicago is only paying $0.79 per bushel!!!”
Farmer 1: “But I owe the bank $0.85 per!!!”
Farmer 2: “Friend, sounds like your loan is just as bad as mine…”
Farmer 1: “Do you think the bank will take less?”
Farmer 2: “You can do what you like. But Chicago is still a day away and I’m no fool. I dumped my load a half-mile ago and am headed back to load up what I can take and will head west to start over.”
Farmer 1: “Yep, that makes sense.”
Yes. The farmers dumped their grain on the side of the road.
And the people starved.
If your public education textbook didn’t have more than one paragraph about this period of history, can you imagine how much ink will be given to teaching our great-great-great-grandchildren about our 2020 story?
Now that we have solved our mystery, the stage is set for our next act.
So “get your popcorn”, sit back, relax and enjoy the show as we continue on our journey with an analysis of the creative genius that is L. Frank Baum’s The Wizard of Oz.
ACT II
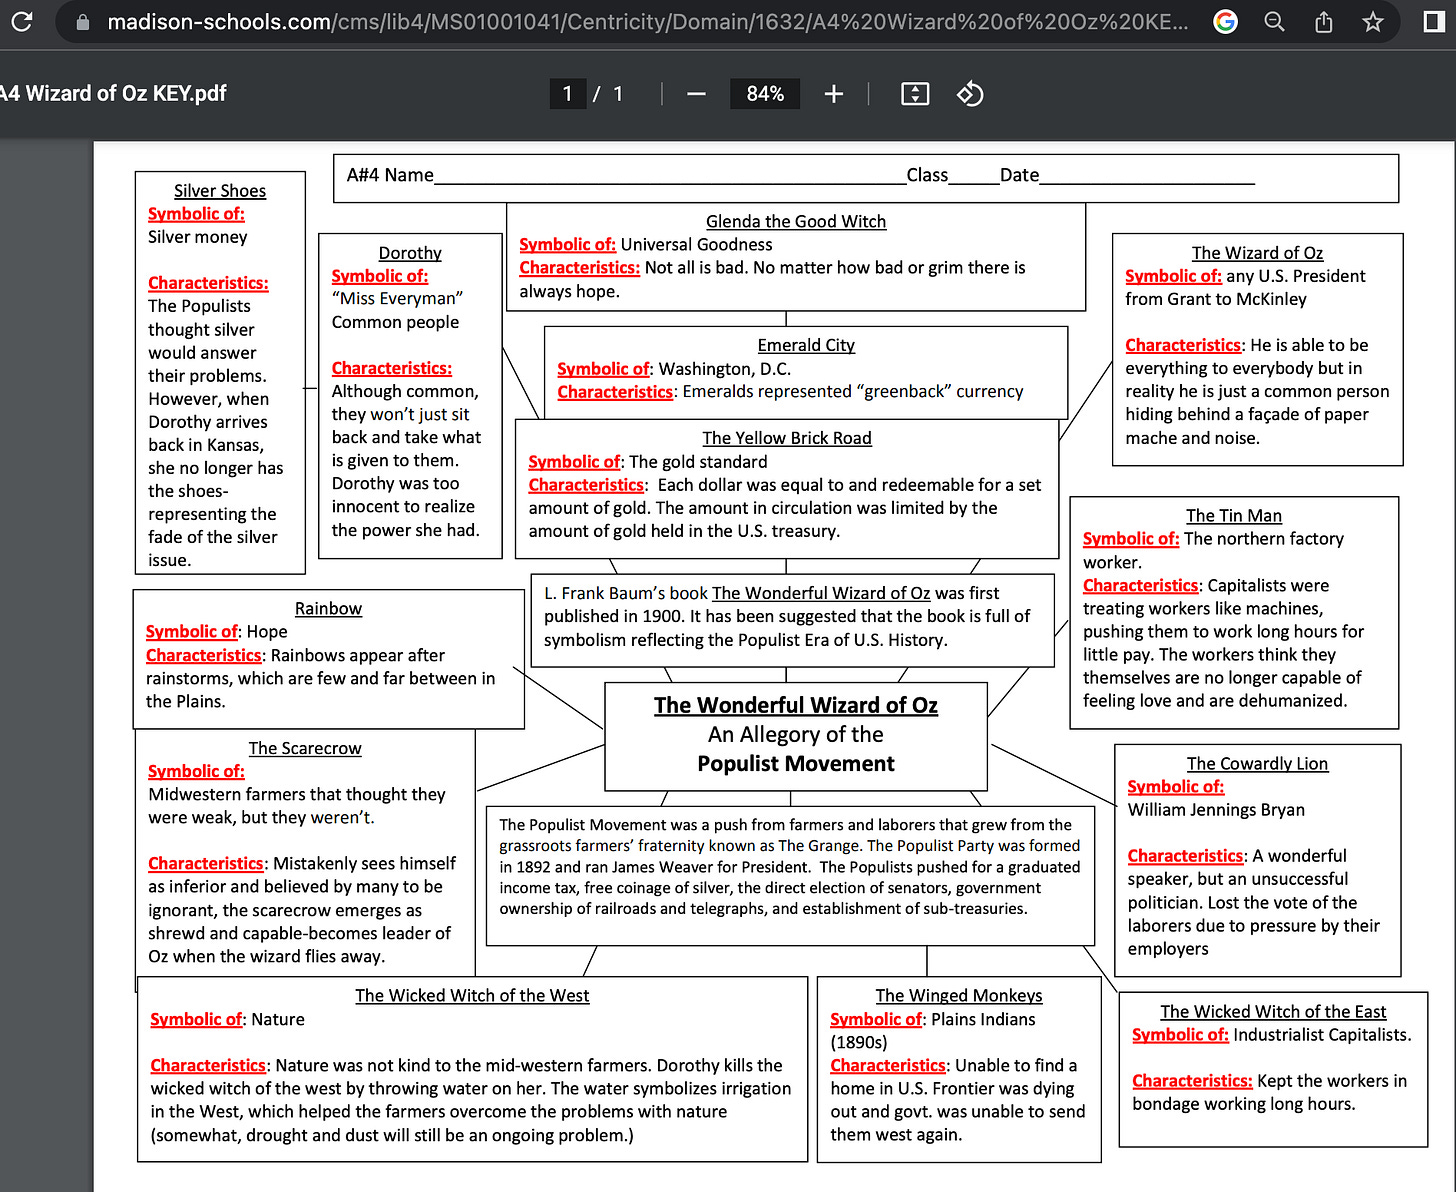
Dorothy represents traditional American value.
Toto represents the political party advocating for a “Gold and Silver Standard”. The idea was that by recognizing Silver, the US Treasury would be able to print more United States Dollars, thereby increasing the money supply and stabilizing prices.
The cyclone represents the suddenly unexpected chaos in prices.
Scarecrow represents the farmer. If only they had brains, they would not have gotten themselves entangled in bad loans.
Tin Man represents the industrial northeast. If only they had a heart, they would have bailed out the farmers instead of starving in their cities.
Cowardly Lion represents William Jennings Bryan. If only he had the courage to support the Gold and Silver Standard.
Wicked Witch of the East represents president Benjamin Harrison.
Wicked Witch of the West represents California’s senator who was loyal to Sacramento’s gold lobby.
Witches represent lies. The words Witch and Wicked are strongly related to the art of candle making. A candle is made by dipping a “wick” (representing a thread of truth) repeatedly into a vat of melted wax (representing lies). Several layers of wax formed about the wick is called a candle. When the candle is lit, the “truth surrounded by lies” are burnt together to produce a dim light. In darkness, it is often difficult to see the wax of a lit candle. The eye naturally centers on the flame. This is why attempts by those able to see the lies have a difficult time pointing out the nature of the wax to others less familiar with how candles are constructed. This is especially the case when such people are standing far away, as they can only see the candle’s flame. To see the wax, either (i) a person must get close to the candle or (ii) the darkness must be replaced with light.
Water represents truth. Because truth melts lies, Dorothy is able to escape the Wicked Witch of the West by dousing her with a bucket of water.
And Dorothy’s Silver Slippers represented the Gold and Silver Standard. Yes, the slippers were originally silver. Then replaced for Ruby Slippers in order for MGM to show off their newest cinematic innovation Technicolor.
ACT III
The parallels and ties between America’s 1890s and 2020s are stark.
Both are examples of the American economy being rocked to its foundations by avoidable errors in political policy.
The malaise of the 1890s was used to support the establishment of the Federal Reserve in 1913. From 1913 to 2008, estimates are upwards of $1 trillion Federal Reserve Notes were created. And the last estimates I’ve seen suggest the amount of Federal Reserve Notes currently in circulation is now in excess of 7x that amount.
As we have discussed a couple times now, the ratio of dollars in circulation to total value of goods and service (which ultimately drives market prices) is be definition directly impacted by changes in money supply. When money supply grows faster relative to the value of the available goods and services, the result is inflation. When money supply shrinks, deflation occurs.
Considering how more than a few nations around the world are moving away from transacting in Federal Reserve Notes (which means all that cash is heading back to the USA like a tsunami of liquidity), it would not surprise me in the least if we woke up someday soon and discovered a loaf of bread costs $35 or more.
[insert 30 seconds of Patrick Gunnels shilling one of Jon Herold’s Gold & Silver advertisers who sponsors Badlands Media here]
Although it seems reasonable our border crisis is the result of the uni-party’s desperate plan to leverage voter fraud in a vain effort to cling to power, I see a simpler explanation. Could it be that moronic chuckleheads at the Federal Reserve are applying simple logic to a complex problem and are attempting to combat the inflationary pressures caused from printing too much money by facilitating immigration? Are they trying to decrease the ratio between money supply and population?
Regardless of the underlying logic that drove our policies to create the border crisis, NCSWIC!; average household purchasing power is decreasing! If this is their plan, then I think their plan is dumb, heartless and cruel. Furthermore, it’s an idea that won’t work. At least, not at the rate the Federal Reserve has been churning out FRNs. I don’t think enough people are entering America fast enough to keep up with their printing presses. It’s as if they think it would have been possible to bail out the Titanic and keep it afloat using a Dixie cup.
Yes. 2020s = 1890s
The only thing 2020 is missing is a children’s story.
A fairy tale that captures and holds the attention of the mainstream consciousness.
A narrative designed to help raise national awareness of the problems that have been placed before us and align us with the proven solutions we need in order to pray our way out of this hot mess.
An allegory in the tradition of The Wizard of OZ, The Emperor’s New Clothes, Pinocchio, The Pied Piper and dystopian wake-up calls like 1984 and The Gulag Archipelago.
Attack of the Blue Meanies is my humble attempt at such a story.
http://attackofthebluemeanies.com/
https://rumble.com/c/DavidTodge
Unfortunately, this “orange pill” isn’t going to automatically “wake up the normies” all by itself. It will need your help if it is to become that for which it was designed.
Please consider any and all of the following:
Watch the video on Rumble
Give it a thumbs up
Email the link to some friends’
Stream a reaction video
To Whom It May Concern: Please consider this Sub-stack post as my express written permission for you to use any and all of my Attack of the Blue Meanies video content distributed via Rumble for the purposes of recording, publishing and distributing your reaction videos. You are hereby granted this non-exclusive, limited-use, world-wide license without fee or royalty. No warranties or guarantees.
or be among the first in your community to wear my over-priced T-shirts
It’s really up to all of us to make this (or similar) story a cultural phenomena.
After all… what else can I do?
I’m just a farmer writer.


